Smart Tools.
Instant Results.
Institutional-grade calculators for Logistics, Finance, and Marketing.
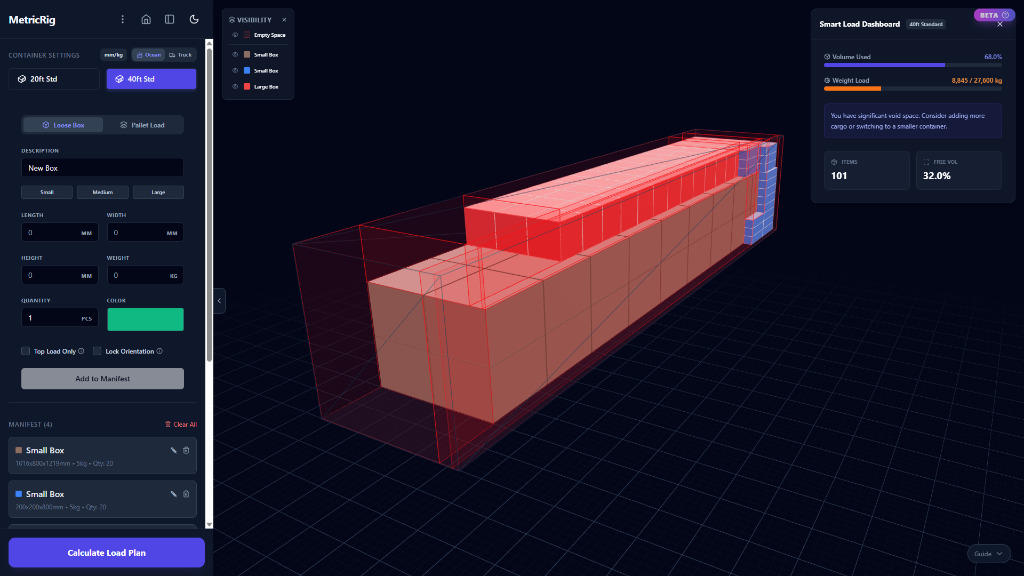
Optimize container loads & freight class
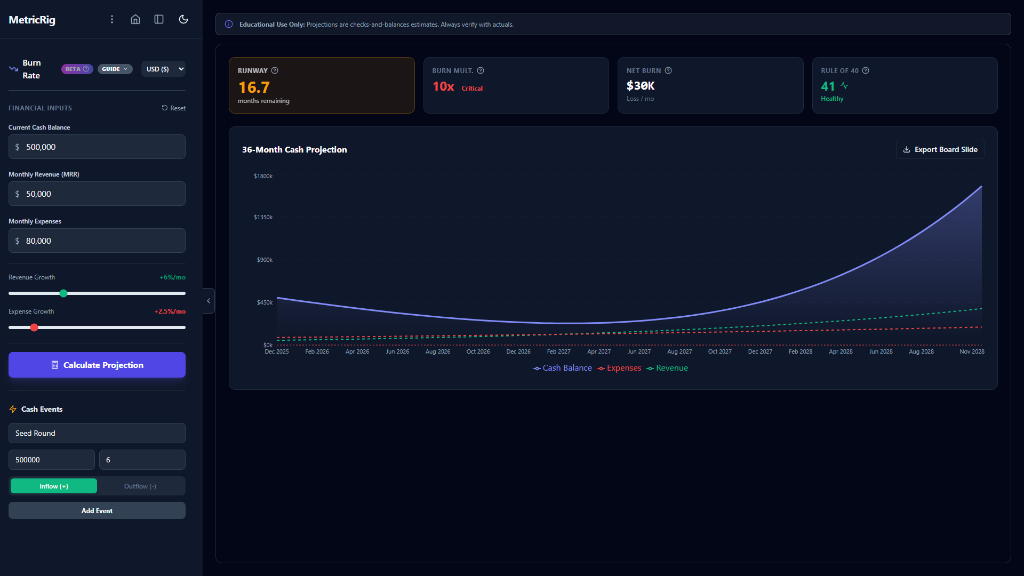
Model burn rate, churn & unit economics
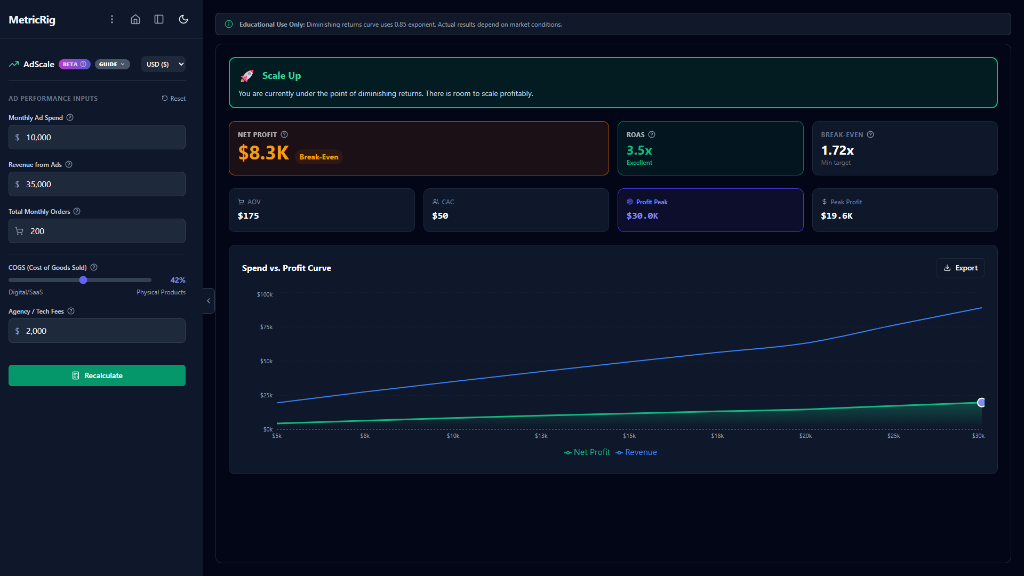
Calculate ROAS, CPM & ad profitability
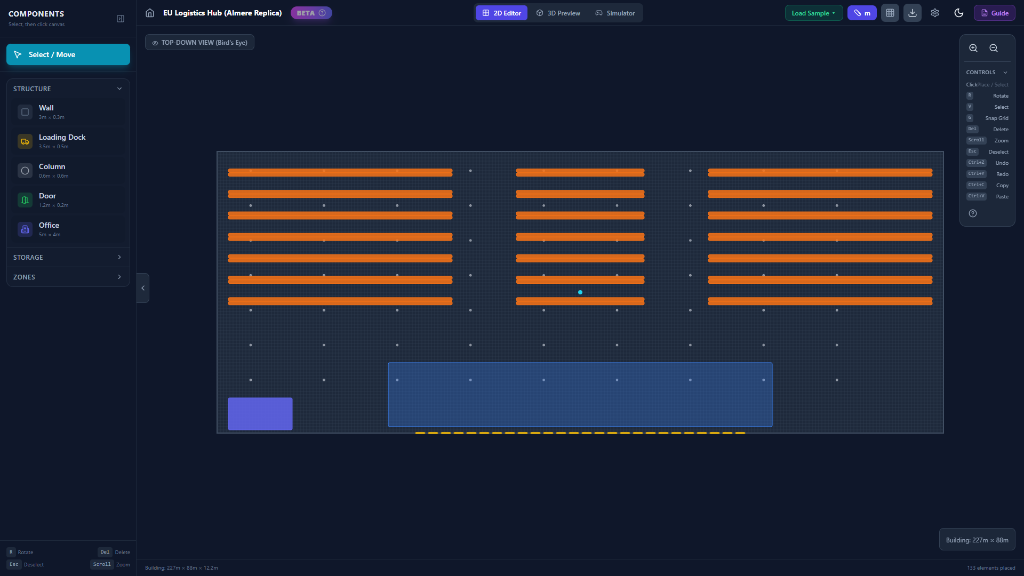
Warehouse Planner
Design. Visualize. Simulate.
The world's first browser-based warehouse simulator. Design layouts in 2D, preview in scale-accurate 3D, and drive forklifts to test your operations.
- Drag-and-drop 2D Layout Editor
- Real-time 3D Digital Twin
- Forklift Simulator with Physics
- Empty Air Tax Analysis
Built for the real world.
No gimmicks. No paywalls. Just a growing suite of professional-grade calculators, free forever.
Logistics Engine
Finance Core
Marketing OS
Built for Utility, Not Extraction.
MetricRig isn't a venture-backed startup chasing growth at all costs. It's a personal project built by a single developer who got tired of bad calculators.
Privacy is the Architecture
Other tools ask for your email before showing results. MetricRig deliberately runs entirely in your browser. Your freight manifests, payroll data, and burn rates never leave your device. There is no database. There is no login. What happens on your rig, stays on your rig.
Engineered, Not Just Estimated
Most "calculators" are simple forms. MetricRig tools like the Container Loader use real physics engines and collision detection. The finance tools track cumulative compounding month-over-month. We don't just multiply two numbers; we simulate the scenario.
Zero Latency
By using WebWorkers and WebAssembly, MetricRig delivers desktop-class performance in a browser tab. You get instant feedback as you drag sliders or resize boxes. No server round-trips. No loading spinners. Just raw speed.
Free Forever
This project is supported by non-intrusive ads, allowing it to remain free used by students, founders, and logistics managers worldwide. No paywalls for "Pro" features. Every tool is full-featured from day one.
"I built MetricRig because I needed a place to do 'napkin math' without opening a spreadsheet or signing up for a trial. I hope these tools help you build, ship, and grow whatever you're working on."
You ask, we answer.
Everything you need to know about the platform.
Your data never leaves
your browser.
MetricRig runs entirely client-side using WebAssembly. We do not store your freight manifests, payroll data, or burn rates on our servers. What happens on your rig, stays on your rig.